The Two Schools of Stock Analysis
Every investor trying to answer the question of whether to buy a stock eventually confronts two fundamentally different philosophies. Fundamental analysis asks: what is this company worth? Technical analysis asks: what is the price likely to do next? Both have large, passionate camps of practitioners. Both produce successful investors. Understanding the difference — and knowing when to use each — is one of the most valuable skills in investing.
What Is Fundamental Analysis?
Fundamental analysis evaluates a stock by examining the underlying business. Practitioners believe that a stock's price will ultimately reflect its intrinsic value — the present value of all future cash flows the business will generate. If a stock trades below intrinsic value, it's a buy. If it trades above, it's a sell or avoid.
Key metrics in fundamental analysis include: Price-to-Earnings (P/E) ratio — what the market pays for each dollar of earnings; Price-to-Book (P/B) ratio — price relative to net asset value; Return on Equity (ROE) — how efficiently a company uses shareholder capital; Free Cash Flow (FCF) — the real cash a business generates after capital expenditures; Debt-to-Equity ratio — financial leverage and balance sheet health; Revenue growth rate — the pace of business expansion; and Net profit margin — how much of each revenue dollar becomes profit.
Fundamental analysts also assess qualitative factors: competitive moat (does the company have pricing power?), management quality, industry tailwinds, and regulatory environment. Warren Buffett and Charlie Munger are the most famous practitioners. Buffett's approach: find wonderful businesses at fair prices, then hold them indefinitely as the compounding works.
What Is Technical Analysis?
Technical analysis studies price and volume patterns in charts to forecast future price movements. The core assumption is that all publicly known information is already priced into the stock, and that price action itself reveals the collective psychology of all market participants — creating patterns that tend to repeat.
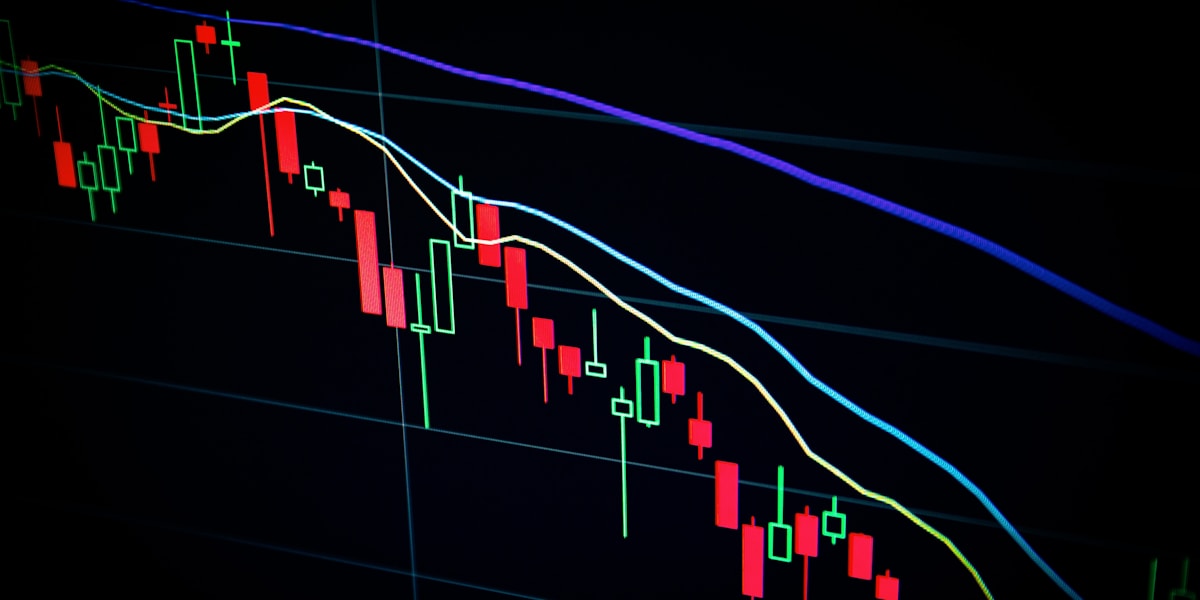
Key technical tools include: Moving averages — the 50-day and 200-day moving averages are the most widely watched trend indicators. A stock trading above its 200-day MA is in an uptrend; below it, a downtrend. The 50-day crossing above the 200-day is the Golden Cross — a bullish signal; the reverse is the Death Cross. RSI (Relative Strength Index) — measures momentum on a 0-100 scale. RSI above 70 suggests overbought conditions; below 30 suggests oversold. MACD (Moving Average Convergence Divergence) — a momentum oscillator that signals trend changes when the MACD line crosses its signal line. Support and resistance levels — price levels where a stock has historically reversed. Volume — confirms price moves. A breakout on high volume is more reliable than one on low volume.
Technical analysis is particularly popular among day traders and swing traders who need to time entries and exits precisely. It's also used extensively in options trading, where timing matters as much as direction.
Key Differences at a Glance
Time horizon: Fundamental analysis suits long-term investors (1-10+ years). Technical analysis is more relevant for short- to medium-term traders (days to months). Data used: Fundamentals use financial statements, earnings reports, and industry data. Technicals use price charts, volume, and derived indicators. Question answered: Fundamentals answer what to buy. Technicals answer when to buy. Valuation: Fundamental analysis produces a price target and margin of safety. Technical analysis produces entry/exit signals. Market assumption: Fundamentalists believe markets are sometimes irrational and misprice stocks. Technicians believe the price always reflects all available information.
Which Works Better?
Academic research leans fundamental. Decades of evidence show that value stocks (cheap relative to earnings, book value, or cash flows) outperform growth stocks over long periods — the so-called value premium documented by Fama and French. Long-term investors following Buffett-style fundamental analysis have produced exceptional results over decades.
However, research also shows that technical signals — particularly momentum — have statistically significant predictive power in the short to medium term. Studies from AQR Capital show that stocks that have outperformed over the past 6-12 months tend to continue outperforming in the next 3-6 months. Moving average crossover systems have historically beaten buy-and-hold in some market conditions, particularly by reducing drawdowns during bear markets.
The honest answer: both work in the right hands, in the right timeframe. Pure technical day trading is brutally competitive — you're competing against high-frequency algorithms with millisecond advantages. Pure fundamental investing requires patience measured in years and the psychological fortitude to hold through 50% drawdowns. Most successful investors blend both.
The Combined Approach
Many professional investors use fundamental analysis to identify what to buy and technical analysis to decide when to buy it. The process: (1) Use fundamental screens to identify stocks trading below intrinsic value with strong business metrics. (2) Watch the chart for a good entry — waiting for the stock to be in an uptrend, near a support level, or showing improving momentum before initiating a position. (3) Use technical stops to manage risk — if the stock breaks below a key support level, it may signal the fundamental thesis is wrong, even before updated financial data is available.
StockSignal24's AI signal engine uses this combined approach: fundamental metrics (P/E, ROE, margins, debt ratios) are weighted alongside technical indicators (50-day and 200-day moving averages, price momentum) to produce a composite BUY, HOLD, or SELL signal with a confidence score.
Bottom Line
Neither fundamental nor technical analysis is universally superior — the right approach depends on your investment horizon, risk tolerance, and how actively you want to manage your portfolio. Long-term investors building wealth over decades are better served by fundamental analysis. Short-term traders managing entries and exits need technical tools. And smart investors of all types benefit from understanding both — using fundamentals to find quality and value, and technicals to optimize timing and manage downside risk.